Many California school districts installed solar under NEM 1.0 or NEM 2.0 with the expectation that it would largely offset electricity costs. For some districts, it has. For others, NEM true-up bills have become an unwelcome annual surprise.
| Bill Start Date | Bill End Date | Simulated Bill: If No Solar | Actual Bill | Net Bill Savings |
|---|---|---|---|---|
| 2024-06-13 | 2024-07-14 | $49,375.03 | $487,787.68 | $(438,412.65) |
| 2024-07-15 | 2024-08-13 | $49,503.45 | $26.49 | $49,476.96 |
| 2024-08-14 | 2024-09-12 | $63,993.59 | $26.49 | $63,967.10 |
| 2024-09-13 | 2024-10-13 | $55,846.18 | $10,288.64 | $45,557.54 |
| 2024-10-14 | 2024-11-12 | $37,731.70 | $8,194.14 | $29,537.56 |
| 2024-11-13 | 2024-12-12 | $29,232.71 | $5,486.21 | $23,746.50 |
| 2024-12-13 | 2025-01-13 | $27,563.76 | $5,047.05 | $22,516.71 |
| 2025-01-14 | 2025-02-11 | $28,955.21 | $5,875.46 | $23,079.75 |
| 2025-02-12 | 2025-03-13 | $26,978.72 | $5,476.34 | $21,502.38 |
| 2025-03-14 | 2025-04-13 | $29,853.91 | $5,435.79 | $24,418.12 |
| 2025-04-14 | 2025-05-12 | $31,337.59 | $6,141.95 | $25,195.64 |
| 2025-05-13 | 2025-06-11 | $46,527.44 | $10,456.69 | $36,070.75 |
| TOTALS | $476,899.29 | $550,242.93 | $(73,343.64) |
If your district is in the latter camp, you are not alone, and there are things you can do about it.
Why True-Up Bills Catch Districts Off Guard
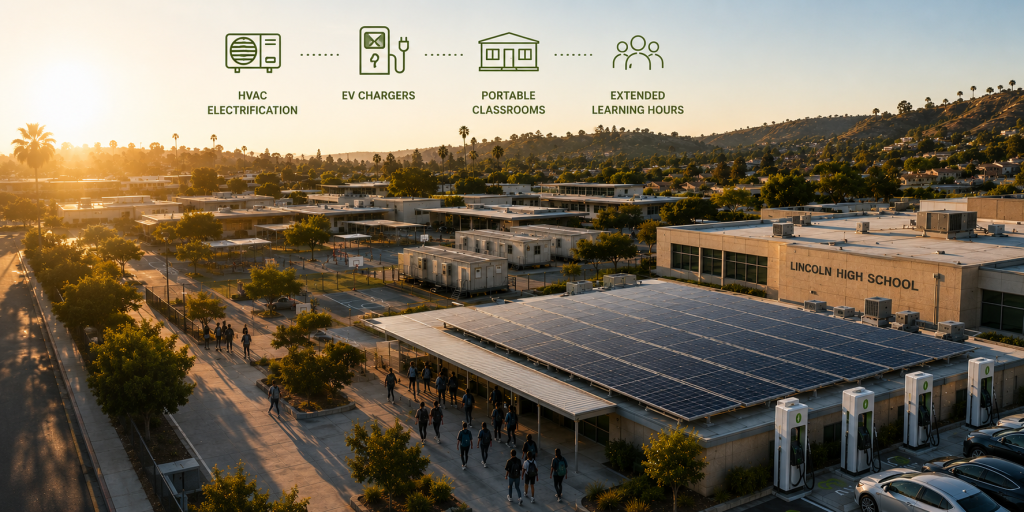
Solar systems are typically sized to offset a district’s energy load at the time of installation. But electricity rates have risen significantly since most of those systems went in. Campus loads have grown too (e.g., HVAC electrification, EV chargers, portable classrooms, extended learning hours). The result is a growing gap between what the solar produces and what the campus actually consumes, and that gap gets settled at retail rates once a year.
The problem is that many districts don’t see it coming. Credits accumulate month to month, bills look manageable, and then the true-up arrives.
Two Ways To Get Ahead Of It
Short term: get visibility
Before anything else, districts need to know what their solar is actually doing relative to their consumption in real time, not at year-end. Solar Shadow, TerraVerde’s solar monitoring platform, gives districts exactly that. Tracking production against consumption throughout the year means no surprises, and it opens the door to small adjustments that can make a real difference before the billing cycle closes.
Longer term: rethink energy strategy
New solar and battery projects are being designed very differently than they were five or ten years ago. Under California’s current Net Billing Tariff, the emphasis has shifted from exporting solar to the grid toward maximizing on-site consumption. A well-designed solar + storage project can reduce how much your district draws from the grid during peak hours, directly reducing the costs that drive true-up bills.
Every district’s situation is different. The right path depends on your existing solar assets, how your campuses are metered, your utility territory, and your overall load. But for most districts, there are opportunities worth exploring.
Is your district navigating NEM true-up bills?
As Energy Program Managers for K-12 School Districts and Community Colleges in California, we can review your solar portfolio, provide your team with clear visibility into your systems, and explore opportunities to offset true-up costs.
Schedule a time to chat with us here.